
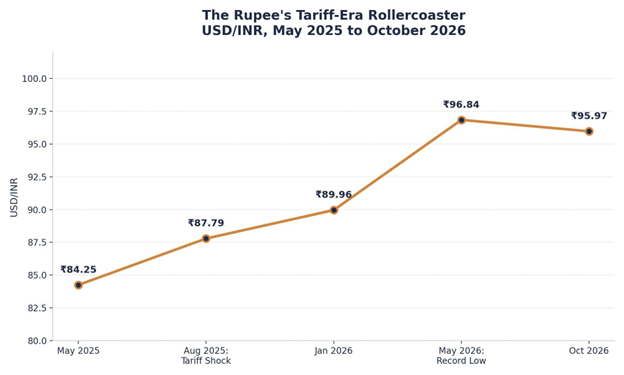
The rupee touched ₹84.25 to the dollar in May 2025. By August, as the US moved to raise tariffs on Indian goods to 50%, it had slid to a then-record ₹87.79. A trade deal in February 2026 brought that tariff rate down sharply. The rupee, if the deal had resolved the problem, should have recovered.
It didn’t. By May 2026, USD/INR had touched a fresh record of ₹96.84, its weakest level ever, months after the tariff “resolution” was announced. By October, it was still trading near ₹96, down roughly 12% from where it stood when the tariff story began.
It’s a story about how many different things move a currency and a market at once, and why tying a portfolio decision to a single policy headline is usually a mistake.
A Policy That Moved Faster Than Portfolios Could
The sequence itself is worth laying out plainly, because it moved quickly even by the standards of trade policy.
In April 2025, the US announced a sweeping round of reciprocal tariffs affecting economies worldwide, India included. Through mid-2025, tensions over India’s continued purchases of discounted Russian oil escalated the rate further, and by August 27, 2025, Indian exports to the US were facing duties of up to 50%, among the steepest imposed on any major trading partner.
On February 2, 2026, an interim bilateral deal brought that rate down meaningfully, to somewhere in the 15–18% range depending on the mechanism applied (a separate legal challenge had, around the same time, struck down part of the original tariff order, pushing some of it through a different statutory route). Trade research groups estimated the effective average, once exemptions and sector-specific duties were netted out, closer to 13.4%.
On paper, that’s a de-escalation. In practice, Indian markets and the rupee spent much of the following months weakening anyway, pulled by foreign investor outflows, elevated crude oil prices and global dollar strength that had little to do with the tariff rate itself.
Why a Trade Policy Halfway Around the World Moves Your Portfolio
The transmission mechanism is fairly direct, even when the underlying cause is diffuse.
Tariffs raise the cost of Indian goods landing in the US, which weighs on earnings expectations for export-heavy sectors. That, in turn, affects how foreign institutional investors price Indian equities, and FII selling pressure shows up quickly in both the Nifty and the rupee, since large sustained outflows mean more dollars leaving and fewer coming in. A weaker rupee then raises the cost of imported inputs and foreign debt servicing for Indian companies, which feeds back into earnings. None of these effects wait for a tariff rate to be finalised. They move on sentiment and expectation, often well before, or well after, the actual policy settles.
That’s part of why the rupee kept weakening even after the February 2026 deal. FII outflows in March 2026 alone reportedly ran close to $12 billion, the steepest monthly outflow on record, driven by a mix of global rate expectations, oil prices and risk sentiment that the tariff deal didn’t address.
Which Sectors Actually Carry the Exposure
Tariff exposure is not evenly spread across the market, and treating it as a single, uniform risk tends to produce either overreaction or complacency, depending on what an investor happens to hold.
| Sector | Tariff Exposure | Why |
| IT Services | Largely insulated | Primarily a services export, not a goods export, and sits outside most reciprocal tariff frameworks |
| Pharmaceuticals | Mixed | Roughly $8.7 billion in annual US exports; impact depends heavily on specific product categories and existing exemptions |
| Textiles | Sensitive, but deal-linked upside | Directly exposed to the tariff rate, but also among the sectors that rallied on news of the February 2026 deal |
| Autos & Auto Components | Meaningful, manageable | Sector-specific tariffs on components remain layered on top of the general rate |
| Metals (Steel, Aluminium, Copper) | High | Separate, persistent sector tariffs that the February 2026 deal did not fully unwind |
| Solar Panels | Severe | Facing import duties as high as 126%, among the steepest of any category |
The point isn’t to avoid exposed sectors outright. It’s to know, concretely, which part of a portfolio’s return is actually riding on a trade policy outcome, rather than discovering it after the next headline.
The Lesson Isn’t About Tariffs
It’s tempting to read the rupee’s chart as proof that the February 2026 deal “didn’t work.” That’s not quite right either. The deal did what it was meant to do, it brought a specific tariff rate down. What it couldn’t do was offset oil prices, global capital flows and a strong dollar, all of which were moving the rupee in the same direction at the same time.
That’s the actual takeaway for a portfolio: a single piece of good policy news rarely resolves a market’s risk entirely, because markets are rarely driven by a single factor in the first place. An investor who went risk-off in August 2025 purely on the tariff headline, and risk-on in February 2026 purely on the deal, would have been reacting to the same partial picture both times.
The more durable response to a story like this isn’t to trade the headline. It’s to build a portfolio that doesn’t need any single headline to go a particular way, diversified enough across sectors, geographies and currencies that a trade dispute halfway around the world is a factor to monitor, not a factor to bet the whole portfolio on.
The Question Worth Asking
For most investors, the real question raised by a year of tariff headlines isn’t “what’s the current rate?” It’s “how much of my portfolio’s outcome depends on getting that question right at the right moment?”
A portfolio built around a single trade relationship, a single currency view, or a single policy outcome is a portfolio making a bet most investors didn’t intend to make. The more resilient approach spreads that exposure, across sectors with different tariff sensitivities, and in some cases across geographies and currencies entirely, so that no single Washington announcement decides how the year goes.
At InCred Wealth, we help investors look past the headline rate to the actual exposure sitting underneath it, sector by sector, holding by holding, and build portfolios structured to hold up regardless of which way the next trade headline breaks.
Sources: USD/INR historical data via Business Standard, HDFC Mutual Fund, Trading Economics and MarketScreener; US-India tariff timeline and rate details via ClearTax, Business Standard and Multibagg market research; sector exposure details via Univest research and Business Standard sector reporting. This article is for general information only and does not constitute investment advice. Currency and trade-policy developments are fast-moving; figures should be verified against current data before publishing.